
Breaking News & Updates
Xero’s financial report reveals BIG loss but share price pop. - eepurl.com/isNmKQ
If you are feeling the pinch financially right now it would be good to find out why. It’s easy to make a statement like “petrol and food prices are through the roof” but the truth might be a bit different when you get all your expenses into a spreadsheet.
Interest rates have gone up a LOT in the last few months so your mortgage payments might be chewing up most of your disposable income. If you have a car loan, personal loan or other debts where the interest rates are much higher you might find that you need to “consolidate” your debts to make ends meet.
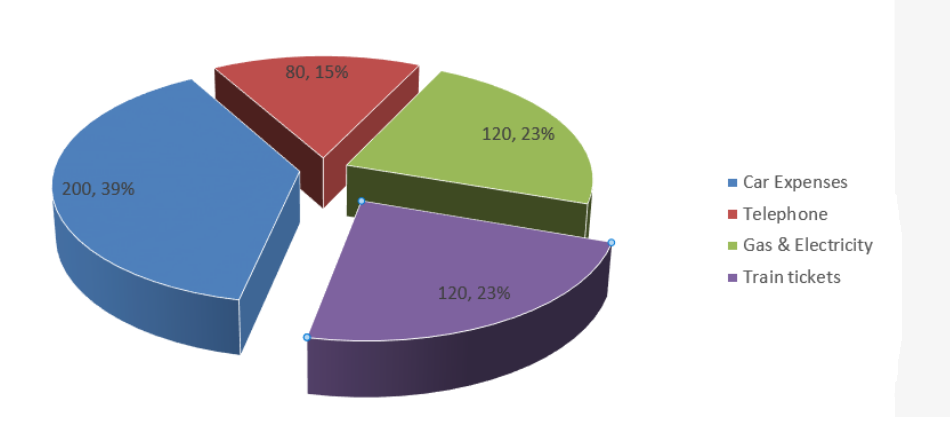
A household budget exercise file is included in the Excel Intermediate Training Course 306 and a similar exercise file is available in the Excel Intermediate Training Course 305. The goal is to help you visualise the changes in your costs and expenses.
Graphs and Charts Leave No Doubts
Creating a spreadsheet of your income and expenses for a personal budget can seem very boring and it will certainly look boring if you don’t apply any formatting. Features like Conditional Formatting can help make your financial information more interesting to look at and makes some figures stand out but nothing shows it more visually than an Excel Chart.
In a personal budget you need to have as much accurate information about your entire income and expenses, even the ones that vary each week/month and those that you only incur once every quarter or year.
With accurate data you can ensure that your bills are paid on time and so you can create savings to achieve your financial goals faster. Having your own personal budget on an Excel spreadsheet will enable you to manage your own financial affairs rather than leave it to someone who will only charge you a fee to manage it for you.
Use a Chart to Highlight Important Costs
If you need to provide a report or other evidence to a lender, bank or debt management company you’ll find the template files in our Microsoft Intermediate Excel Course 305 combine a Microsoft Word document (Report) with an Excel chart that highlights major expenses. You can use the Microsoft Office files for your own personal budget.

Learn how to identify and chart individual items from a large and complex spreadsheet and format that chart to show the information as a dollar figure or percentage (or both). Better still learn how to link the Excel spreadsheet with all your figure with your Microsoft Word document so that the figures are LIVE and updated if you change the information in your spreadsheet.
Many Businesses Have Budgets and Forecasts
The Microsoft Excel skills you learn creating a personal budget will not only help you understand your own finances but give you skills and confidence to use Excel to work with business financials.
Some students or even new business owners wonder how they can create a forecast of future income when they don’t know what is going to happen in the future but having a figure based on your best estimates is a good place to start.
If you have ever read a prospectus or information memorandum (NERD ALERT!) you’ll see the many ways that businesses can forecast their future income.
If you want to create your own personal budget here are some good steps you can start with:
- Write down what matters to you and Set your goals
- Think about your goals in timeframes like:
- next three months (short term),
- the next year, and the next three years (medium term)
- in 10 years time (long term)
- Figure out your available income (take-home, net pay, net profit).
- Write down all your expenses to find out where your money is really going
- Use bank and credit card statements,
- Identify fixed expenses like rent, car loans, student loans etc.
- Determine variable expenses like food, clothing, and entertainment
- Apply your budget to limit how much you spend and make sure your expenses are less than your total income
- If you need to, identify costs that can be reduced or eliminated and adjust your budget.
- Pay yourself first and save as much as you can every month.
- Explore putting aside an emergency savings fund that can cover six months of your living expenses in case you need it.
- Review your budget regularly to make sure it is still relevant and ensure you are on track to achieve your goals.
Beginners to Advanced Microsoft Excel training is included in Excel COMPLETE. Get access to our templates and exercise files and ongoing training and support in how to use Excel to achieve your personal goals AND work goals.
-- Did you like what you read? Want to receive these posts via email when they are published? Subscribe below.









[…] in the past about one of our Microsoft Excel beginners course case studies that gives you the Excel template and some practical tasks to help you pull together your own budget. When you enrol into the Excel COMPLETE training course you’ll cover some more advanced Excel […]
[…] If you need to get a handle on your cost of living and understand where your money is going read this short article. […]